Microsoft Power BI, a cloud-based business intelligence platform, is growing in popularity with many of today’s businesses. Power BI’s interactive dashboards provide advanced data visualization, transforming unrelated data sources into accessible, cohesive insights into key metrics throughout your organization.
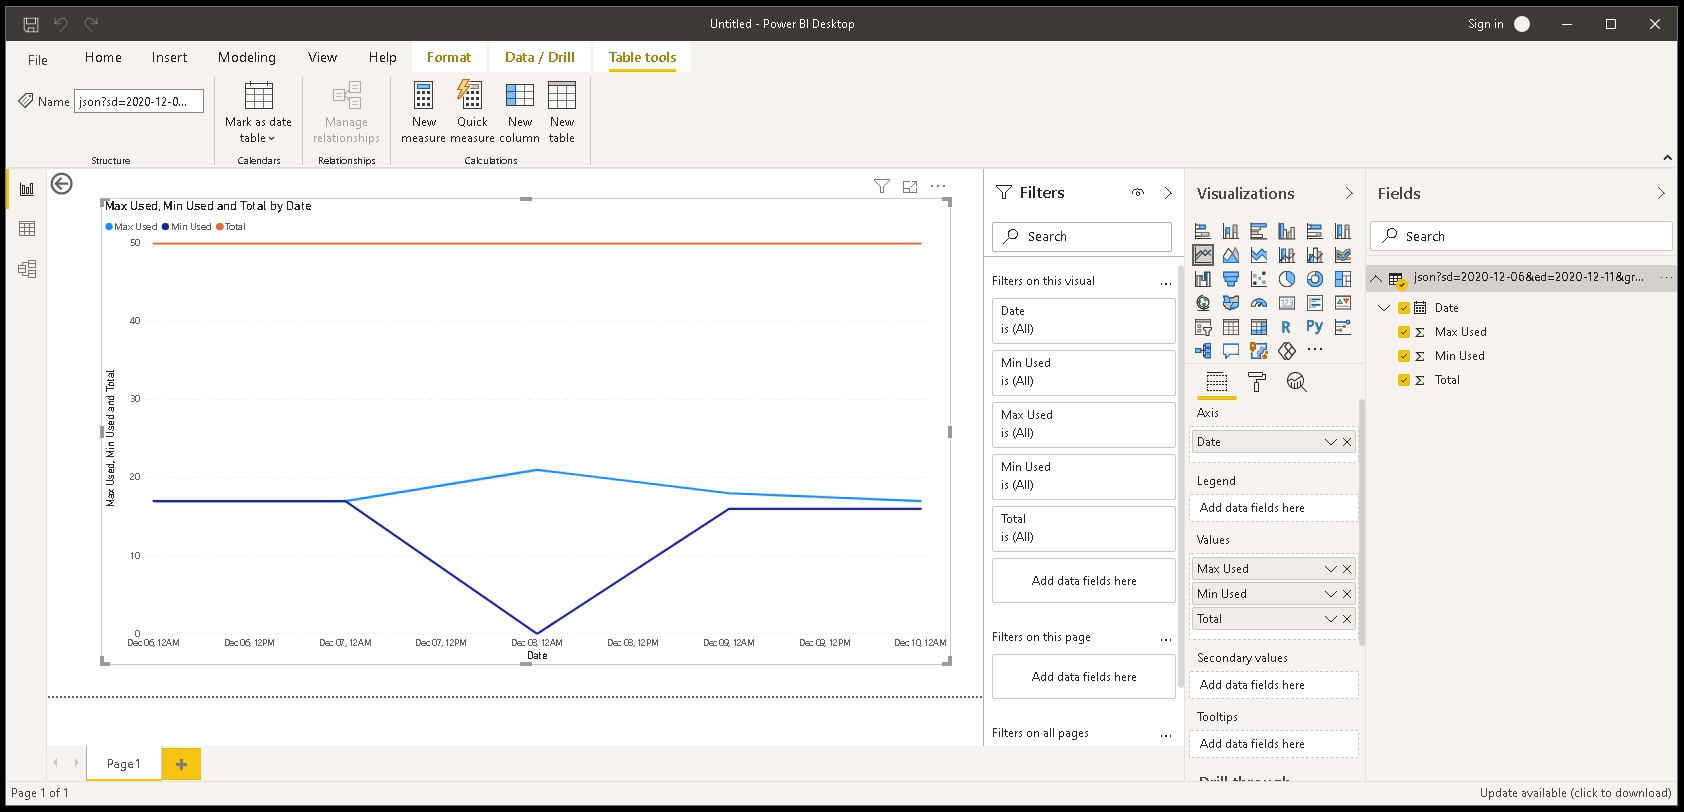
As explained in our related blog article, Generating Custom Reports from License Statistics with Microsoft Power BI, the License Statistics API gives you complete access to all the software license usage data that License Statistics tracks, which you can use as input for Power BI.
Power BI gives you the ability to aggregate data from multiple sources, so you can combine License Statistics’ detailed license usage data with virtually any other data sources — such as your organization’s CRM, CMS, databases, and cloud services — to create correlated reports, dashboards, and charts.
For example, you could create reports that take data from License Statistics along with data from your security system, user directory (AD, LDAP), and company calendar to correlate license usage with hours reported for a particular project or to analyze when users have active licenses but are spending time doing other activities (such as meetings or scheduled breaks).
It’s easy to see how using License Statistics usage data with Power BI can bring you new insights into your license usage that help you optimize license management across your entire organization.
For complete information about using License Statistics with Power BI, see Using the API with Power BI in License Statistics Online Help.
